


Recognize Statistical Questions
Introduction:
In this chapter, we will learn to recognize statistical questions, use data and identify a statistical question with multiple answers and identify a statistical question with two answers.
8.1.1 Recognize a statistical question
Example 1:
Ms. William wrote a question on the board. Then she collected student responses to the question and recorded them in a tally chart. What question could she have asked? Is there more than one possible response to the question? Explain.

Solution:
Ms. William would have asked, “How many books did you read last week?”

This is a statistical question because it has a range of responses, which you can see in the tally chart.
We can display the answers to Ms. William ’s question in a bar graph.

Example 2:
Mrs. Joyce asked her class of 20 pupil a question and recorded the responses in a tally chart. What question could she have asked? Is there more than one possible response to the question? Explain.

Solution:
Mrs. Joyce would have asked, “What is your favourite type of movie?”
This is a statistical question because it has a range of responses, which you can see in the tally chart.
We can display the answers to Mrs. Joyce’s question in a bar graph.
8.1.2 Use data to identify a statistical question with multiple answers
Dot plot:
A dot plot can be used to display the answers to a statistical question.
Example 1:
What statistical question could have been asked to collect the data shown in the dot plot?
Solution:
The dot plot shows the number of minutes different students spent on homework. The statistical question that could have asked is “How many minutes did you spend on homework yesterday?”
Example 2:
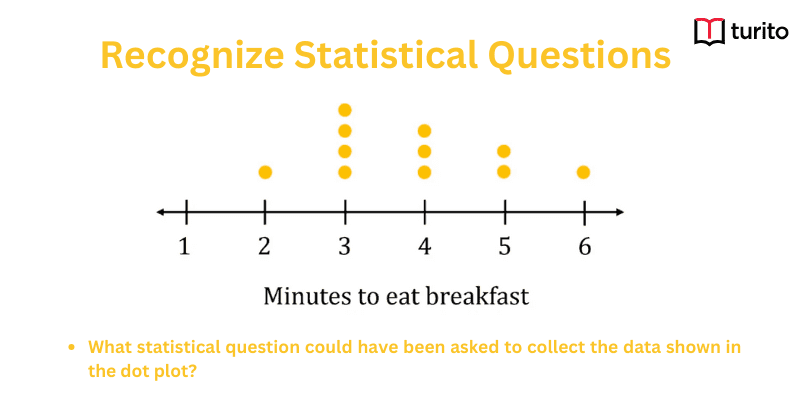
What statistical question could have been asked to collect the data shown in the dot plot?

Solution:
The dot plot shows the number of minutes different students spend on eating breakfast. The statistical question that could have asked is “How many minutes did you take to eat your breakfast?”
8.1.3 Use data to identify a statistical question with two answers
Example 1:
Mrs. Carolyn asked her students to express their opinion on mathematics. The frequency table shows the results. What question did Mrs. Carolyn likely ask? Is this a statistical question?

Solution:
Mrs. Carolyn likely asked a question such as “Do you like math?” There are only two answers, Yes or No. Because there is more than one possible answer, this is a statistical question.
Concept Map:

Exercise:
- Determine whether the below given question is statistical question or not In which months are the birthdays of everyone in your class?
- Determine whether the below given question is statistical question or not Does Sue wear glasses?
- Determine whether the below given question is statistical question or not Who is the current president of the United States?
- Determine whether the below given question is statistical question or not How tall are the students in Grade?
- Determine whether the below given question is statistical question or not What is the least populated state?
- Determine whether the below given question is statistical question or not How many fish are in the pond?
- Mr. Borden asked his students, “How far from school do you live?” Is his question a statistical question? Explain.
- Kim asked her classmates, “How many siblings do you have?” She collected the following responses:
0, 1, 2, 1, 2, 0, 3, 1, 0, 5, 5, 1, 3, 1, 0, 2, 4, 1, 3, 0.
Make a dot plot to display the data. - Ms. Miller asks parents, “Do you support switching to a new lunch vendor for our school program?” How many different responses could she get? Is this a statistical question?
- What statistical question could have been asked to collect the data shown in the dot plot?

What have we learned:
- Recognize a statistical question for the given data/tally chart.
- Identify a statistical question with multiple answers for the given data.
- Identify a statistical question with two answers for the given data.
Related topics

Obtuse Angle: Definition, Degree Measure, and Examples
What is an Obtuse Angle? In geometry, an angle that is greater than 90 degrees but lesser than 180 degrees is called an obtuse angle. We can easily recognize an obtuse angle because it extends past a right angle. Obtuse angle explained in detail with examples but first learn about angles. Type of Angles Geometry […]
Read More >>
Line Segment in Geometry: Definition, Symbol, Formula, and Examples
A line is a straight, one-dimensional figure that extends endlessly in both directions in geometry. It has no starting and ending points. When we define a starting point but not an ending point of a line, it is called a ray. Another important term associated with the line is a line segment. Line Segment Definition […]
Read More >>Area of Irregular Shapes for Grade 3 – Simple Methods & Examples
What Is the Area of an Irregular Shape? The area of an irregular shape is the space that it occupies, although it does not follow a clean formula. In contrast to the squares or perfect rectangles, irregular shapes have sides that are uneven or their angles don’t line up evenly. That is what makes them […]
Read More >>
Addition and Multiplication Using Counters & Bar-Diagrams
Introduction: We can find the solution to the word problem by solving it. Here, in this topic, we can use 3 methods to find the solution. 1. Add using counters 2. Use factors to get the product 3. Write equations to find the unknown. Addition Equation: 8+8+8 =? Multiplication equation: 3×8=? Example 1: Andrew has […]
Read More >>

Other topics


Comments: